
Tier 1
M2 Money Supply
+3,434%
The closest thing to the "printing volume." How much dollar-denominated money the Federal Reserve has created since Nixon closed the gold window.
A playful-but-honest global inflation measure. Three forces braided into one number: monetary debasement pushes the price up, population growth adds mouths, and purchasing-power convergence drags the global average toward developed-market levels. The index rises when any of the three do.
When the gold window closed in 1971, the dollar began a slow decay. Each tier below tracks that decay through a different lens. The ones closest to the "real" printing of money (M2) and to real global prices (Coke, Big Mac) have compounded far faster than the Bureau's official headline number. The gap between them has a name.
The closest thing to the "printing volume." How much dollar-denominated money the Federal Reserve has created since Nixon closed the gold window.
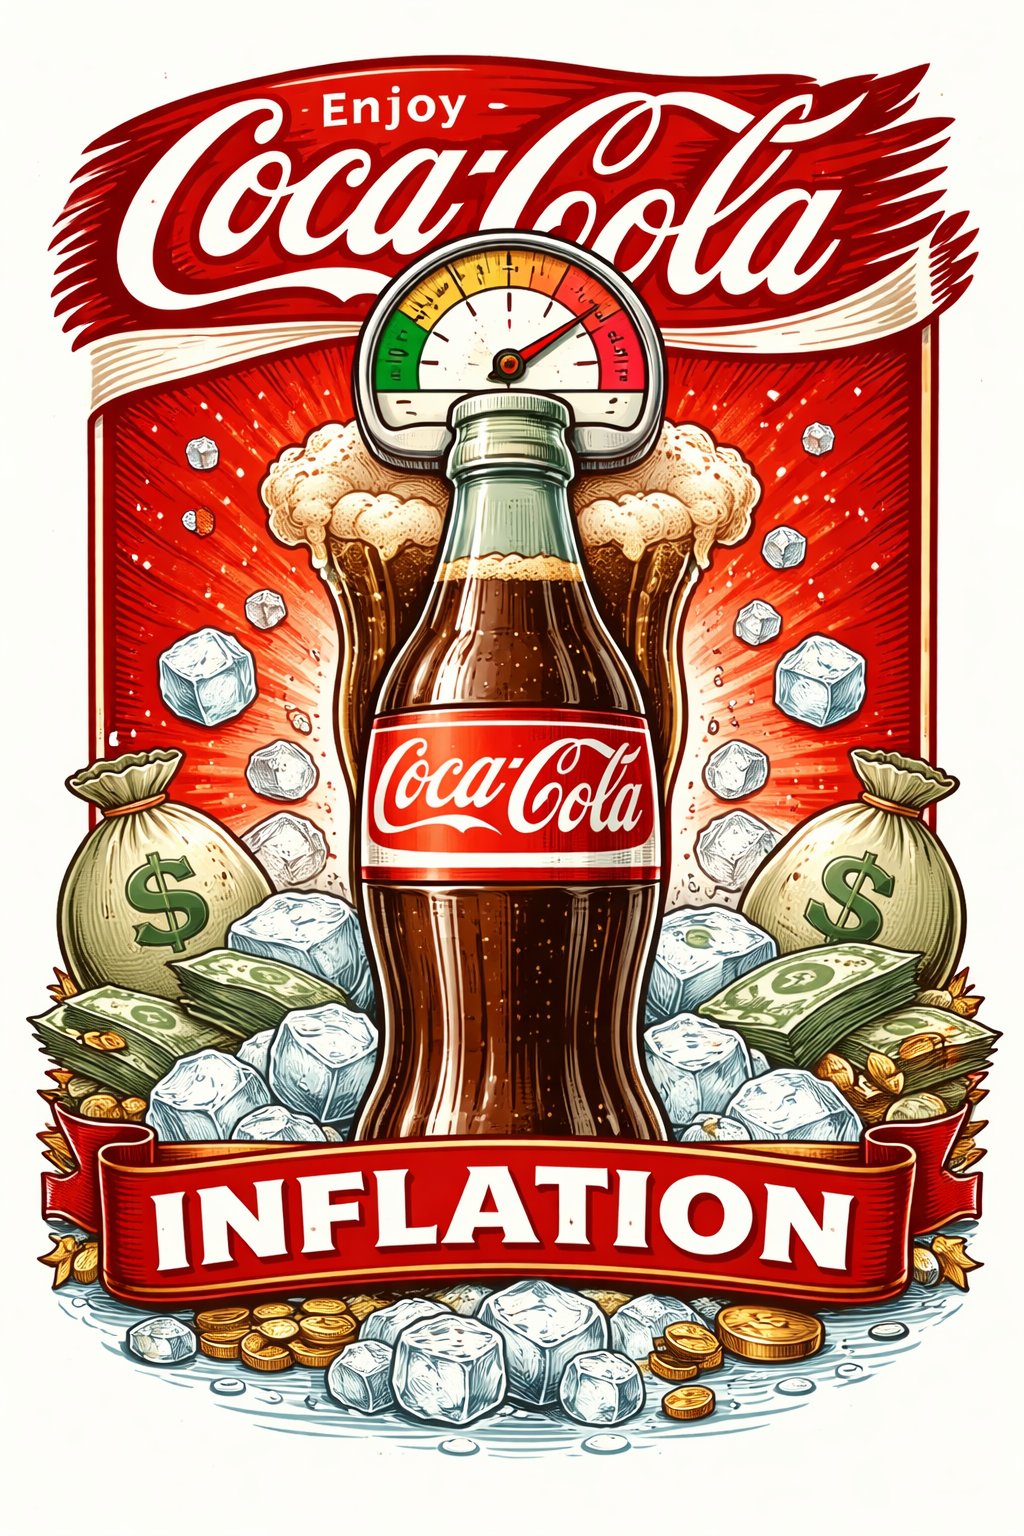
Global price of a single-serve Coca-Cola, multiplied by every human alive. Reflects monetary debasement, population growth, and global purchasing-power convergence in one number.
The Economist's famous single-country cost-of-living gauge. Commodity + labor + rent + energy baked into one burger. Tracks domestic inflation without the global-convergence kicker.
The government's consumer price index. Smoothed, substituted, hedonically adjusted. The lowest number in the chart — which is exactly why policymakers prefer it.
The index is repriced each December 25 — not because anything special happens that day, but because giving the world a Coke has always been a holiday metaphor. Here's every reading since the gold window closed.
| Year | World Population | Price/Coke | Total Index | What happened |
|---|
Sourced from the United Nations' World Population Prospects, which publishes annual mid-year estimates. December 25 population is interpolated from the mid-year and end-of-year figures.
Country-level prices for a single-serve Coca-Cola (roughly 500 mL, supermarket retail) are aggregated from public cost-of-living databases (Numbeo, Expatistan), weighted by population, and converted to USD at the prevailing annual-average exchange rate.
M2 and CPI come from FRED (M2SL, CPIAUCSL). Big Mac
prices from The Economist's long-running annual series. All indexed to 100 on
January 1, 1971.
The 1971 Coca-Cola television spot “I'd Like to Buy the World a Coke” aired during the holiday season and became one of the most famous ads in history. That phrase is the source of this index's name. Repricing on Christmas Day is the joke and the tribute.
The Buy the World a Coke Index is not a policy proposal, not an investment signal, and not endorsed by the Coca-Cola Company or any government statistical agency. It's an academic curiosity that happens to capture three real inflationary forces simultaneously, in a format anyone can intuit.
The index rises when: (1) dollars lose purchasing power — monetary debasement, (2) more people are born — population growth, or (3) global consumer prices converge toward developed-market levels — the "catch-up" effect as lower-income countries approach middle-income purchasing power. All three have been happening continuously since 1971, compounding together.
“Coca-Cola,” “Coke,” the contour bottle silhouette, and the 1971 advertisement are trademarks of The Coca-Cola Company. This site uses the phrase and imagery academically and editorially for commentary — no affiliation, endorsement, or product promotion is implied.